Query Troubleshooting using SQL Server Profiler
Disclaimer: SQL Server Profiler has been officially deprecated by Microsoft. Microsoft now recommends using Extended Events instead. SQL Server Profiler is still around, and for the basic purpose of this post, works quite well.
Ever find yourself troubleshooting performance issues with a 3rd party application or wondering why your database server seems to be working way too hard during certain times of the day? Database performance issues can be especially frustrating when hosting applications that are beyond your control. Many times, reaching out to a software vendor with performance questions can result in finger-pointing and blame-dodging since there are so many variables that can affect performance. Fortunately, SQL Management Studio has a tool that lets you quickly see exactly what queries are running on your DB server in real-time.
Microsoft describes SQL Server Profiler as "an interface to create and manage traces and analyze and replay trace results. Events are saved in a trace file that can later be analyzed or used to replay a specific series of steps when trying to diagnose a problem." (Source). While the tool itself has many uses, I'm going to outline a very basic use case; real-time query monitoring of a single SQL Server instance.
Requirements
SQL Server Profiler requires a licensed edition of SQL Server (Development, Standard, or Enterprise). If you are running SQL Server Express Edition, you may need to look into 3rd party tools such as ExpressProfiler.
SQL Server Profiler is included with SQL Server Management Studio. SQL Server Management Studio version 17.9.1 was used when writing this post.
Basic Usage
-
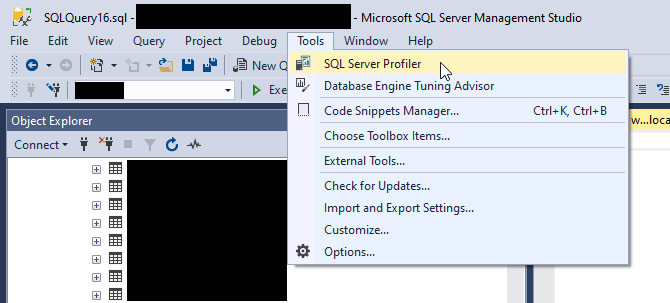
Choose Tools, SQL Server Profiler from inside of SQL Management Studio. You can also launch the application by searching for SQL Server Profiler in the Start menu.
-
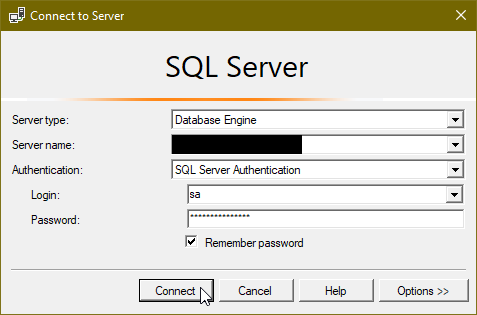
Login to SQL Server Profiler using your admin credentials.
-
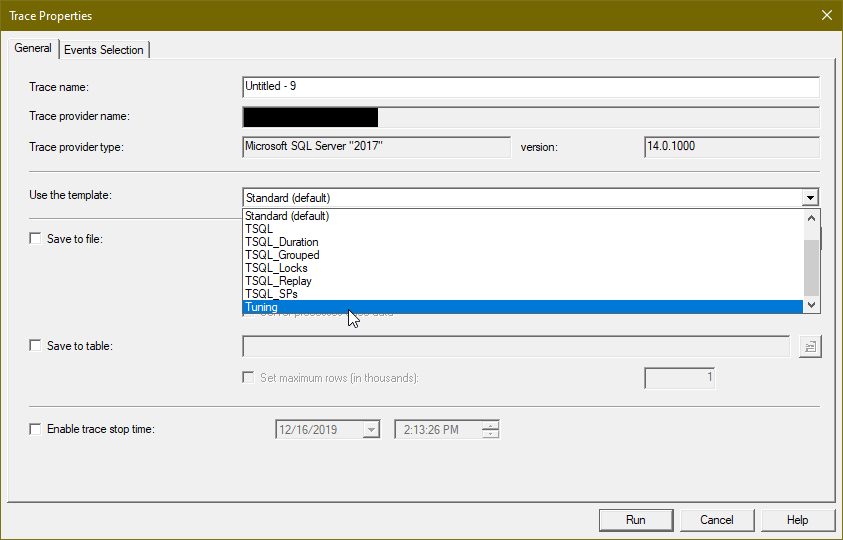
Start a new trace and select from one of the predefined trace templates on the General tab. We are using the Tuning template in this example. You can find a list of predefined templates and their purpose in the Microsoft Docs.
-
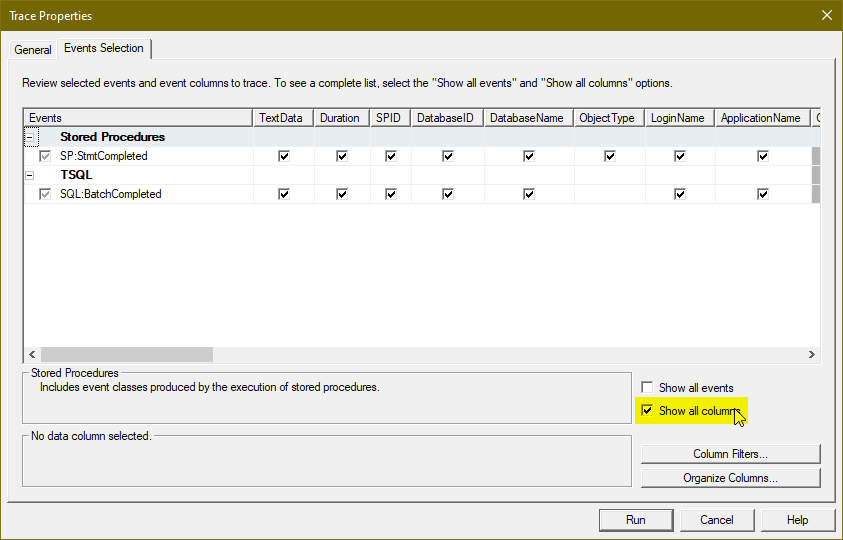
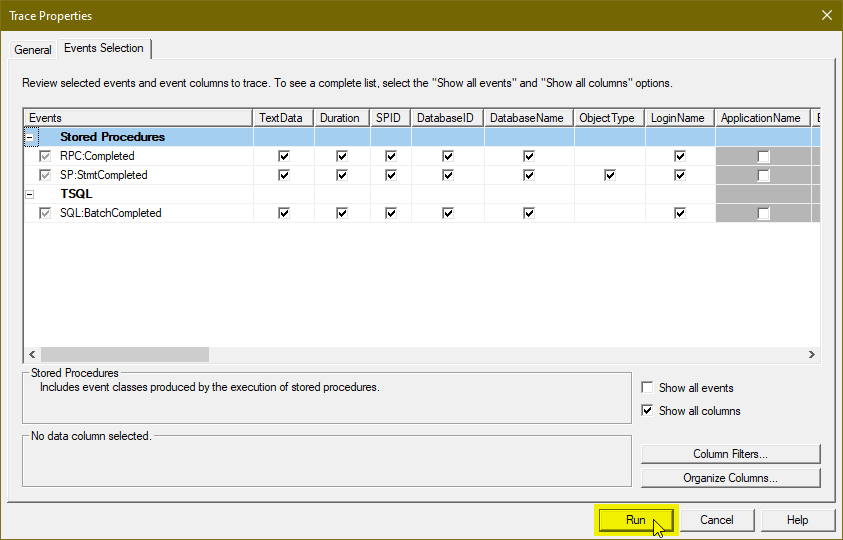
(Optional) You can also select additional events and columns to trace under the Events Selection tab. Select the appropriate Show all events or Show all columns checkbox to show all of the available events and columns. You can also filter events that will be displayed by clicking the Column Filters… button.
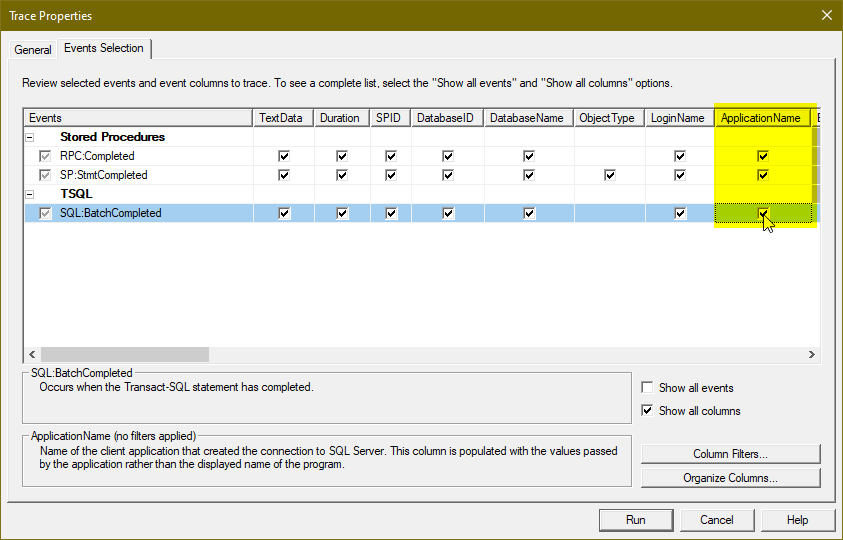
In this example, I'm going to use a column filter to only show queries run in SQL Management Studio. I'll start by ensuring the ApplicationName column is selected for the trace.
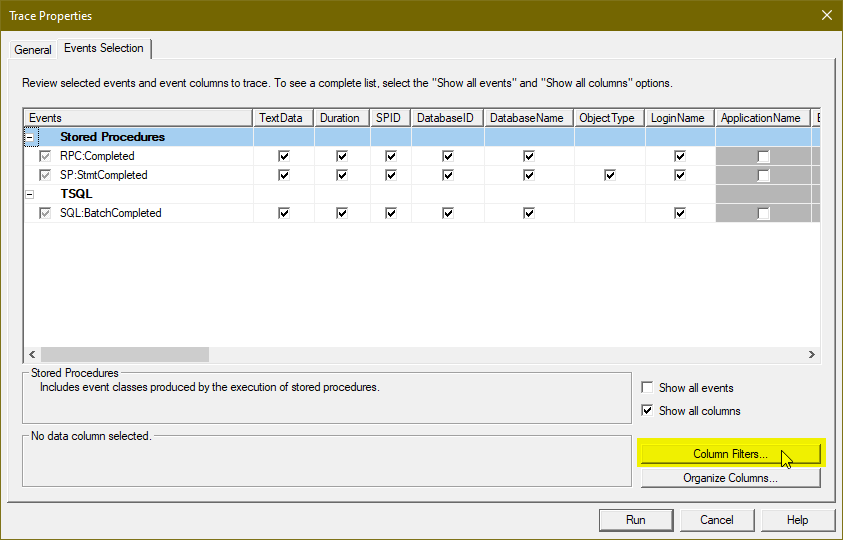
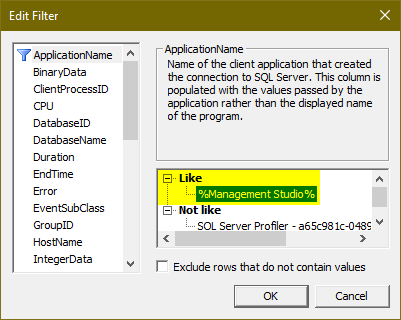
Next, I'll add a column filter to only show events from clients with a name LIKE '%Management Studio%'. Of-course, you can modify this match clause as you see fit.
-
Once you are happy with your settings, click on Run to start the trace.
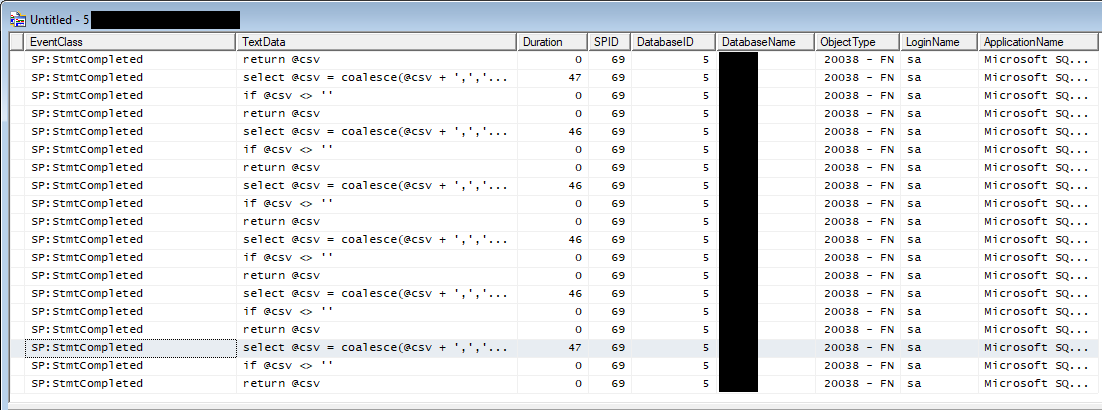
While the trace is running, you will see the results in real-time and can pause/resume the trace as needed.